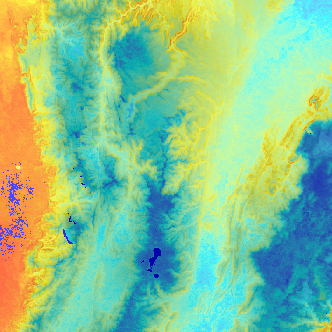
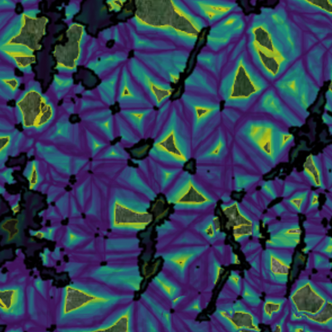
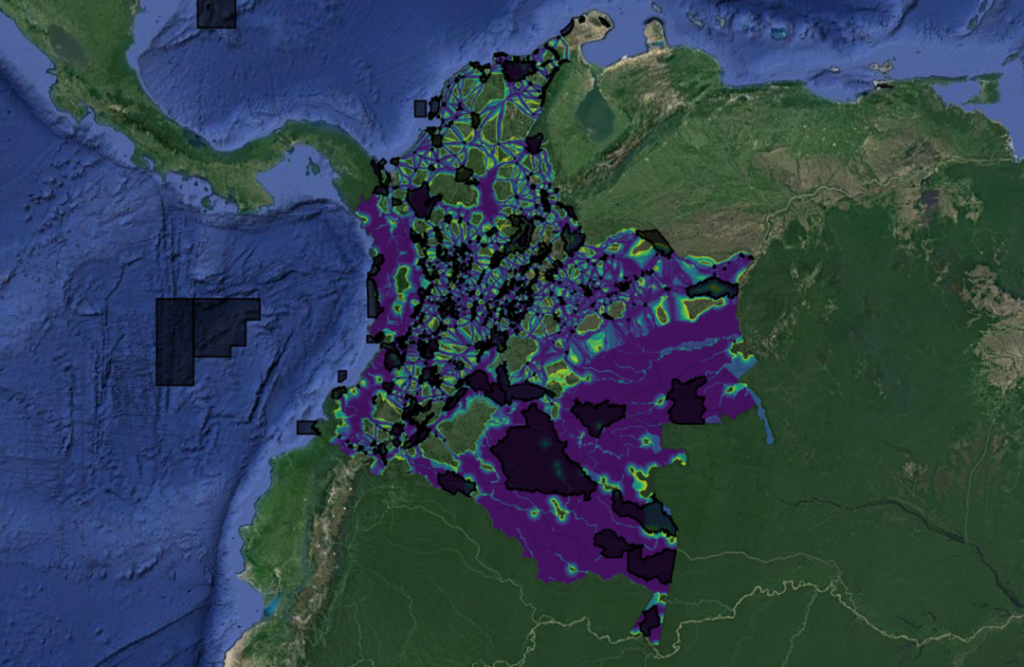
Knowledge about the geographical distributions of species in present and future scenarios is essential to define surrogates for systematic conservation planning strategies, and to prioritize conservation areas that are more likely to support climate change adaptation in conservation actions. The aim of this integrated system is to establish a baseline to prioritize conservation actions based on climate change adaptation across the multiple regions in Colombia.
Understanding the geographical distributions of species, both in present and future scenarios is of most importance to determine suitable surrogates for systematic conservation planning strategies. This knowledge enables to prioritize conservation areas that have a higher likelihood of supporting effective climate change adaptation in conservation actions. The Alexander von Humboldt Institute for Biological Resources, funded by the National Geographic Society (AI for Earth Innovation Grant NGS-86896T-21), has created support tools to integrate, process, and analyze species distribution information with Earth observations. We use this integrated system to establish baseline measurements of the representativeness of biodiversity across multiple regions in Colombia, considering climate change scenarios and the potential to improve connectivity between protected areas. Our system generates terrestrial climate refugia and species distribution maps to inform the Colombia Biodiversity Observation Network (Colombia BON), SIM-SINAP, BioTablero, and other national tools, which require monitoring complementary conservation areas resilient to climate change in Colombia.
Goals
- Estimate the potential distribution of multiple species under climate change scenarios using ecological niche modeling methods (current, 2050s, 2070s; birds, frogs, lizards, mammals and plants).
- Improve the Biomodelos platform to update species distribution information and generate high-resolution species distribution models, providing web services that allow consultation of species maps.
- Integrate independent tools with Biomodelos to identify strategic complementary conservation areas. (SIM-SINAP indicator flows).
- Calculate the extent of the area that would ensure all species are adequately conserved across different ecosystem types.
Geographic impact
The models are enriched with comprehensive field data, biological collections, and citizen science data, empowering them to effectively guide conservation initiatives throughout Colombia. Moreover, the tools devised through this project are universally applicable, transcending geographical boundaries, as they are designed to be compatible with the provided training materials.
Motivation
The Alexander von Humboldt Institute for Biological Resources implements the Colombia BON and is part of the National Environmental System, providing technical support to the Colombian Ministry of Environment (MinAmbiente). Therefore, the system will be shared broadly throughout the Colombia Biodiversity ObservationNetwork (BON) GEO BON community and with a level of generalization to facilitate other national and regional BON developments. The project promotes the broad use of Earth observations in biodiversity research through the generation of software use case vignettes and other guides and training materials. Importantly, MinAmbiente/SINAP has plans to use consolidated information to inform specific actions through mandates by the National Council for Economic and Social Policy (CONPES 4050), the highest national planning authority for the Colombian Government.
Methods
- Modelling tool
- Case 1: One species
- Species distribution models (SDMs) are computational models used to predict the potential geographic distribution of species based on environmental variables. This example could be used to obtain ecological niche models for a single specie.
- Case 2: Species-small samples
- The effectiveness of SDMs is strongly impacted by the number of records employed during their development, with predictions based on larger sample sizes typically yielding superior results compared to those derived from smaller datasets. Therefore, this example could be used to run ENM for a single species with small samples.
- Case 3: Multiple species
- In this example, we are going to work with occurrences of the Monk Parakeet or Myiopsitta monachus. Originating from South America, particularly Argentina, this bird species has successfully established populations in various parts of the world, including North America, Europe, and Asia. Therefore we will run an ENM to describe an invasion process of Myiopsitta monachus is characterized by its adaptability and resilience in colonizing new habitats.
- Case 4: Projecting to different temporal period
- Niche models have become essential tools to study the impacts of climate change on species distributions, allowing for improved forecasting of future distributional areas compared to earlier methods. By applying the models developed for projecting the model in time-slicing, we can gain insights into how species might respond to changing environmental conditions or expand their ranges.
- Case 5: Multiple species stack
- In this example, we are going to work with occurrences of the Monk Parakeet or Myiopsitta monachus. Originating from South America, particularly Argentina, this bird species has successfully established populations in various parts of the world, including North America, Europe, and Asia. Therefore we will run an ENM to describe an invasion process of Myiopsitta monachus is characterized by its adaptability and resilience in colonizing new habitats.
General results
Products
Species distribution modelling system to identify complementary conservation areas
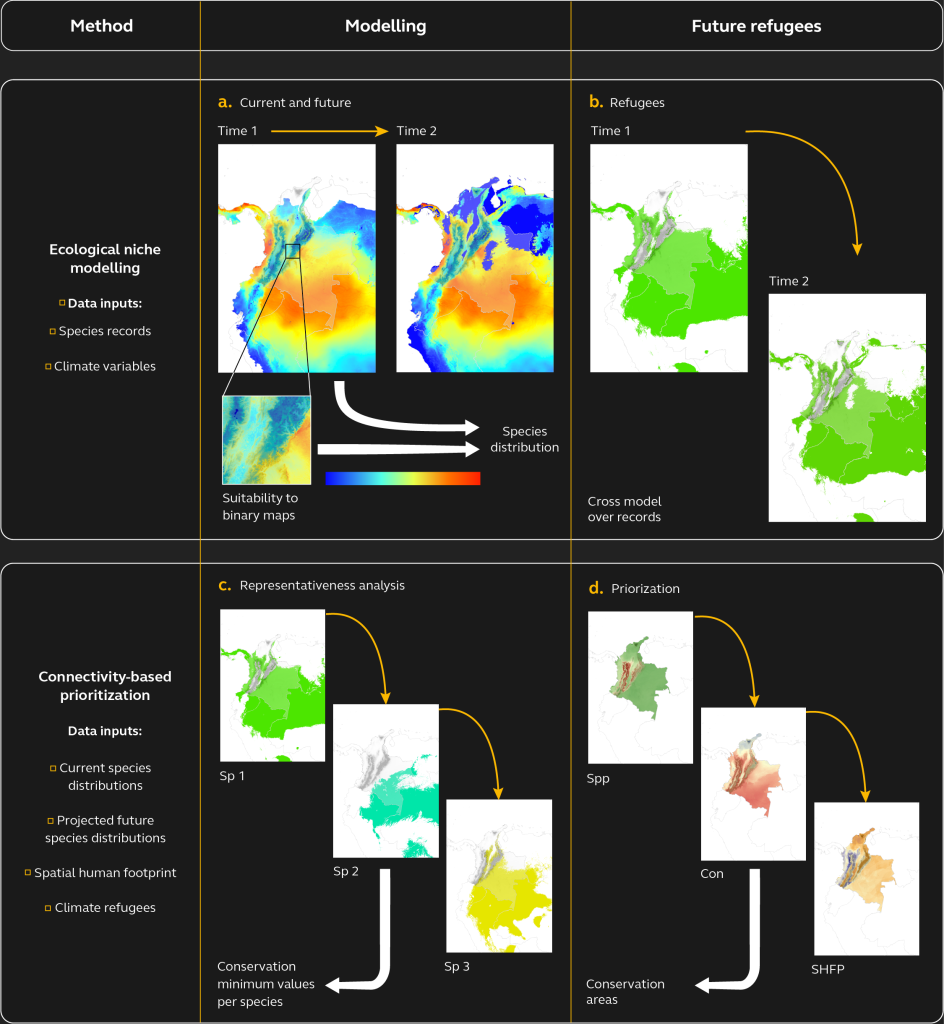
Biomodelos-sdm tool: This repository stores functions to automate the construction of Species Distribution Models (SDM). These functions use an automated and versatile SDM general routine that comprises several steps. First, they format occurrence data as required and create geographic areas for training and projecting models if desired. Second, they crop and mask environmental variables for both current and future conditions. Third, the functions train SDMs using one or more algorithms and assess their performance quantitatively. Finally, the best models are combined using an ensemble approach, and projections can be made for various scenarios as desired.
Climate refuges and important areas for biodiversity
The ecosystems of Colombia present a high value due to their essential richness and species endemism. However, biodiversity and their services are at risk due to the transformations that occurred in the Anthropocene (high population density, high demand and farming production, salinization and water pollution, cultivation of illicit crops) and because of climate change. Specifically, climate change could lead biological populations to shift their distribution to different altitudes and latitudes than they historically occupied, species may face extinction if unable to respond to the changes. These changes in biodiversity imply changes in ecosystems and, therefore, a loss of ecosystem services. Therefore, it is necessary to understand the impacts of climate change and identify potentially vulnerable or resilient sites to develop nature-based alternatives that contribute to species conservation and ecosystem stability.
While species are susceptible to climate change because increases or reductions in temperature affect their reproduction and development cycles, climate refugees or areas of climatic stability can reduce this vulnerability. The response of biodiversity will depend on the biology of species, their response to the environment, the climatic stability of specific areas, and the connectivity between protected areas. It will also depend on species finding refuges where the effects of climate change are mitigated and where necessary conditions for survival exist. It has been proposed that such refuges can be found in mountainous areas and transitions between biogeographic regions. However, the search for these refuges is just beginning for Colombia (find here).
Report Bio-Areas considered as potential corridors affected by speed of climate change
Identifying complementary conservation areas based on connectivity
A key strategy to ensure the long-term maintenance of biodiversity, but also, a global goal to measure the progress towards biodiversity conservation, is to promote areas that are more likely to increase connectivity between remaining habitats. High levels of landscape connectivity are critical for species adaptation under anthropogenic climate change, as they facilitate individuals and populations to track suitable climate conditions. The level of connectivity among protected areas (PAs) also affects the ability of species to colonize and survive habitats that lower species’ extinction risk. We identified the priority areas that can be included as complementary conservation strategies by including corridors that connect current protected areas. The workflow and all the associated codes can be found here:
https://github.com/afsuarezca/Prioritization_connectivity_Colombia/tree/main and https://github.com/PEM-Humboldt/Prioritization_connectivity_Colombia.
BioModelos of species in response to climate change
Within this thematic line, information about taxonomic diversity has been combined with climatic variables to identify hotspots of species vulnerability of climate change. An example of this is the crossing carried out to identify hotspots of species vulnerability of climate change. In the case of birds, strong fluctuations in their abundance have been observed between urban and rural environments due to climate variations and the reduction of vegetation, which cause changes in the flowering and fruiting times of plants.
Concentration of birds in the Vulnerable category and high vulnerability to climate change
The highest number of species, between 139 and 168 species, are found in the departments of Caquetá, Guaviare, Putumayo, Guainía, Vaupés, and Amazonas. The entire Colombian Pacific coast has intermediate values of vulnerable birds, 47 to 96 species, while the Amazonian Andean foothills have low values of vulnerable birds, 19 to 47 species.
To date, there are few geographic representations of sites with species vulnerable to climate change, according to their ecophysiology. Therefore, based on the availability of bird distribution maps, the list of vulnerable birds and those with high vulnerability to climate change12, a map of the concentration of Colombian birds vulnerable to climate change was created by adding the BioModels.
78 %
of all birds in Colombia will be highly vulnerable to the impacts of climate change in the Amazon region -168 species-, Pacific -152 species- and high mountain Andean areas -59 species-
31 %
of 235 bird species increased their range, 20 % showed a decline and 49 % did not change.
301
bird species will lose between 33% and 43% on average of their total range under future climate conditions, and up to 18 species could lose their entire climatically suitable range altogether.
The current map indicates that there are many more birds with high vulnerability to climate change than projected and that they are distributed in areas other than the Andes. The loss of species due to climate change produces changes in the composition and consequently the ecological rehabilitation of ecosystems and the provision of ES
Concentration of Vulnerable birds (VU) by department
The departments of the Amazon, together with Nariño and Caldas, have the highest number of vulnerable birds (VU). Meanwhile, the departments of La Guajira, Magdalena, Atlántico, and Tolima have the lowest number of species, although this is still significant, ranging from one to 53 species.
Based on previous information, it was estimated that the departments with the highest number of vulnerable bird species (VU) are Cauca, Nariño, Antioquia, Boyaca, Meta, and Cundinamarca-11. However, the figures are updated according to the priority of the departments if the number of birds vulnerable to climate change is considered. In other words, the first six departments in priority would be Vaupés -28-, Guainía – 26-, Amazonas -24-, Guaviare -24-, Vichada -23-, Caqueta -16-, and Putumayo -15-. Therefore, the priorities shift from departments with high value for their species richness located in the Andes, to departments with high value for the presence of birds vulnerable to climate change in the Amazon.
Integrating this information is essential to generate knowledge that can guide conservation actions. For example, based on the concentration map of vulnerable bird species in the face of climate change, priority integrated management of biodiversity is urgent in regions such as the Amazon and the Colombian Pacific. Priority actions -include reducing and limiting atmospheric emissions- and adaptation -planned and anticipatory processes to reduce vulnerability- in the face of climate change.
APPLIED BIOLOGICAL CASES
We show two cases of study in which the tool was used to run ecological niche models:
Dowloading material
All the rasters generated through the modeling phase of the project are accessible at:
The prioritization maps based on connectivity and climate change are available here:
work team
- Elkin A. Noguera Urbano – Researcher Instituto Humboldt – Biomodelos Team
- Andrés Felipe Suárez – Griffith University, Australia – Spatial prioritization models
- Hawthorne Beyer – Centre for Biodiversity and Conservation Science. The University of Queensland, Australia – Spatial prioritization models
- Cristian Cruz Rodríguez – Instituto Humboldt – Researcher Instituto Humboldt
- Carlos Jair Muñoz – Instituto Humboldt – Biomodelos team.
- Jose Ochoa Quintero – Instituto Humboldt
- Erika Suarez – Instituto Humboldt – Platform development support
- Luz Adriana Moreno – Instituto Humboldt
- Laura Mora – Communications
- Julián Güiza – Graphic Design
- Diego Armando Herrera – Web design
